- Hair color on x-axis
- Change bar fill by Eye color
- Split the graph into multiple panel by Sex
ggplot(df, aes(x = Hair, y = Freq))+ geom_bar( aes(fill = Eye), stat = "identity", color = "white", position = position_dodge(0.9) )+ facet_wrap(~Sex) + fill_palette("jco")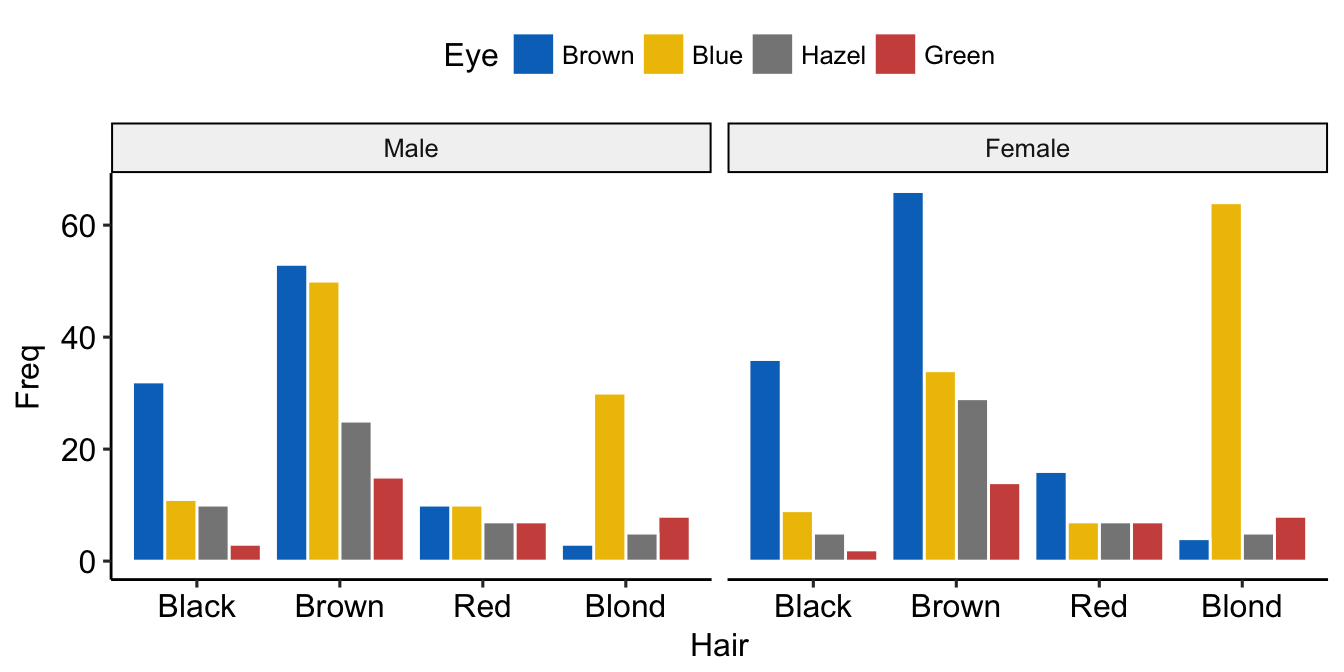
Balloon plot
Balloon plot is an alternative to bar plot for visualizing a large categorical data. We’ll use the function ggballoonplot() [in ggpubr], which draws a graphical matrix of a contingency table, where each cell contains a dot whose size reflects the relative magnitude of the corresponding component.
Demo data sets: Housetasks (a contingency table containing the frequency of execution of 13 house tasks in the couple.)
housetasks ## Wife Alternating Husband Jointly ## Laundry 156 14 2 4 ## Main_meal 124 20 5 4 ## Dinner 77 11 7 13 ## Breakfeast 82 36 15 7- Create a simple balloon plot of a contingency table. Change the fill color by the values in the cells.
ggballoonplot(housetasks, fill = "value")+ scale_fill_viridis_c(option = "C")
- Visualize a grouped frequency table. Demo data set: HairEyeColor . Create a multi-panel plot by Sex

Mosaic plot
A mosaic plot is basically an area-proportional visualization of observed frequencies, composed of tiles (corresponding to the cells) created by recursive vertical and horizontal splits of a rectangle. The area of each tile is proportional to the corresponding cell entry, given the dimensions of previous splits.
Mosaic graph can be created using either the function mosaicplot() [in graphics] or the function mosaic() [in vcd package]. Read more at: Visualizing Multi-way Contingency Tables with vcd.
Example of mosaic plot:
library(vcd) mosaic(HairEyeColor, shade = TRUE, legend = TRUE) 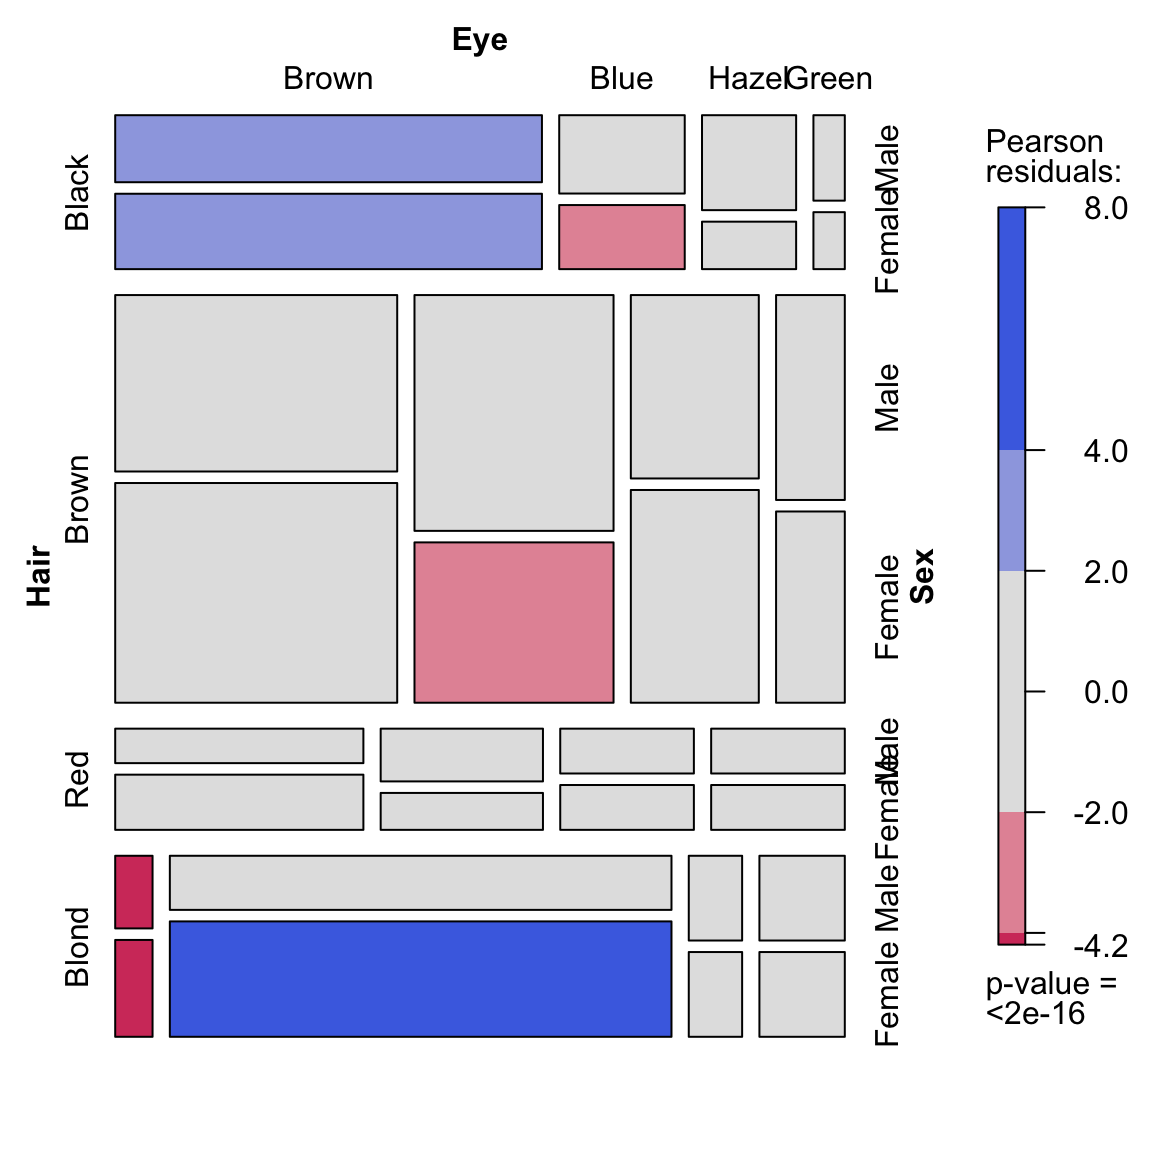
Correspondence analysis
Correspondence analysis can be used to summarize and visualize the information contained in a large contingency table formed by two categorical variables.
Required package: FactoMineR for the analysis and factoextra for the visualization
library(FactoMineR) library(factoextra) res.ca 
From the graphic above, it’s clear that:
- Housetasks such as dinner, breakfeast, laundry are done more often by the wife
- Driving and repairs are done more frequently by the husband
Enjoyed this article? Give us 5 stars (just above this text block)! Reader needs to be STHDA member for voting. I’d be very grateful if you’d help it spread by emailing it to a friend, or sharing it on Twitter, Facebook or Linked In.
Show me some love with the like buttons below. Thank you and please don't forget to share and comment below!!
Avez vous aimé cet article? Donnez nous 5 étoiles (juste au dessus de ce block)! Vous devez être membre pour voter. Je vous serais très reconnaissant si vous aidiez à sa diffusion en l'envoyant par courriel à un ami ou en le partageant sur Twitter, Facebook ou Linked In.
Montrez-moi un peu d'amour avec les like ci-dessous . Merci et n'oubliez pas, s'il vous plaît, de partager et de commenter ci-dessous!